 Color Banding Rows In A Worksheet
This page describes how to create color banding of rows on a worksheet.

If you have a large number of rows in a worksheet, especially if those rows span many
columns, you may find it useful to color alternate rows or alternate groups of rows with
another color. This creates a visual style similar to an accounting ledger or good old-fashioned
computer green-bar paper. Excel has built-in styles for this, and of course you can do it
manually. However, if you sort the rows or you insert or delete rows, the color banding will
get out of whack.
The solution to this problem is to use Conditional Formatting from the Format menu
to apply a format to the cells. The formula used in the Conditional Formatting rule is based
solely on the row number, so the formatting it applies will remain intact as you sort the rows or insert or
delete rows.
The formatting techniques described here create color bands of a fixed number of rows, regardless of the
content of the cells on worksheet. To create color banding based on the content of the cells, see the
Content Banding With Conditional Formatting page. When banding is applied,
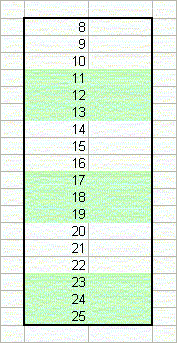
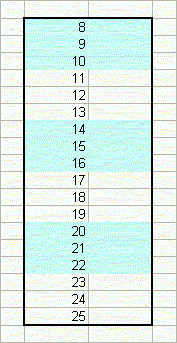
the cells will have alternate bands of color, as shown below:


The image on the left shows even banding, where the even number of row groups are colored. The image on the right shows
odd banding, where the odd numbers of row groups are colored.
First, select the rows that you want to format. Then, go to the Format menu and choose
Conditional Formatting. In this dialog, change Cell Value Is to Formula
Is. The formula to use depends on whether you want the color applied to the first and every other
group of rows, or you want no color on the first group of row and color applied to the second and
then every other group of rows. Each group of rows can contain 1 or more rows.
To apply the color on the first group and every other group, enter the following formula in the
formula bar in the Conditional Formatting dialog.
=MOD(ROW()-Rw,N*2)+1<=N
where Rw is the row number of the first cell in the rows that are to be
formatted, and N is the number of rows in each banded group. For example,
if the first row is 12 and you want each band to contain 3 rows, you would use the formula:
=MOD(ROW()-12,3*2)+1<=3
Click the Format button and select the color or pattern that should be applied to the
cells.
If you want the banding to appear only on rows that are not empty, you can use a formula like
=AND(MOD(ROW()-Rw,N*2)+1<=N,ROW($D5)<>"")
In this formula, change the reference to $D5 to the
cell reference that is to be tested for data. You should fix the column
specifier with the $ character, but do not fix the
row number.
To apply the color starting in the second band of rows, use the following formula in the
Conditional Formatting dialog:
=MOD(ROW()-Rw,N*2)+1>N
As before, Rw is the row number of the first row to be formatted and
N is the number of rows in each band. For example, if the first row is
12 and the bands contain 3 rows, use the following formula:
=MOD(ROW()-12,3*2)+1>3
By using Conditional Formatting rather than directly styling a range, you can prevent the colors from
getting out of order when you sort the range or insert or delete rows.
If you want the color banding to be based on the content of the cells (alternating between formatted and
unformatted when content changes), see Content Based Banding

 |
This page last updated: 28-February-2009. |